
Welcome back to the Inquiry Lab!
In my last post, I shared ways I teach and coach students to nudge each other toward deeper learning. Today, we’ll get into ways the teacher can leverage a workshop approach to similar effect, especially when it comes to inquiry work.
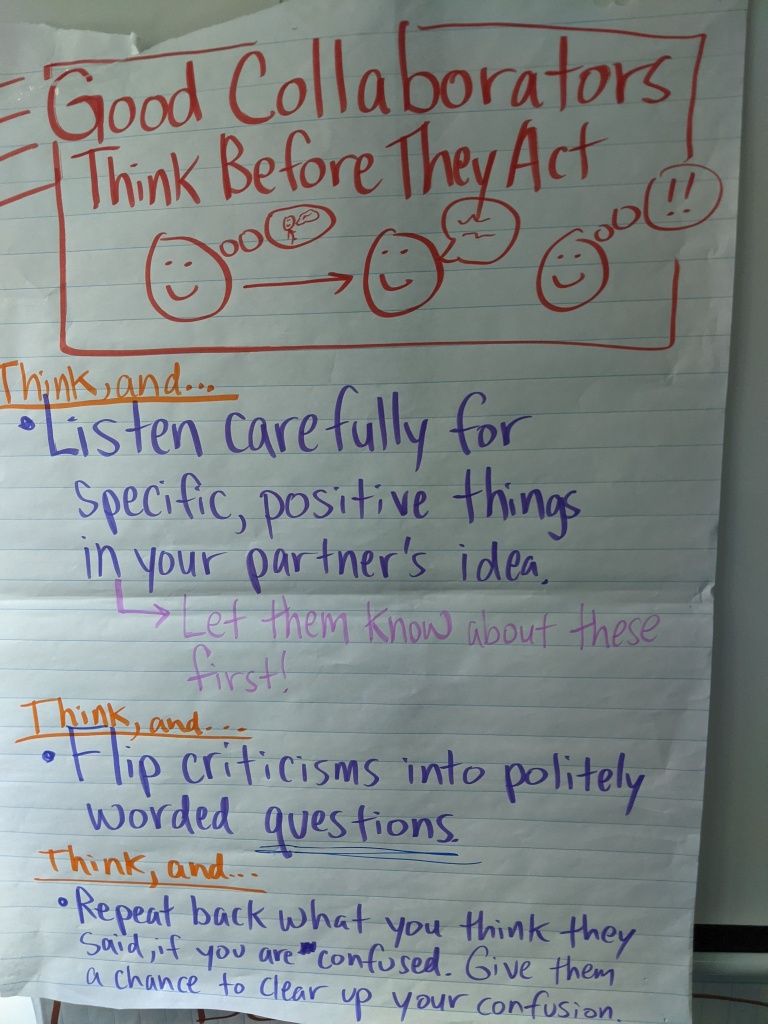
It all begins with effective anchor charts.
To me, an effective anchor chart enticingly displays a strategy(-ies) you’ve taught that students can use, and use often.
Most of what I have learned about anchor chart best practice I’ve learned from Kate and Maggie Roberts. We’ll focus on two types of anchor chart in this post.
1. A record of mini-lessons that I can point to and say, “Which strategy are you using today?

2. A display that breaks down one of the more complicated strategies.
Recently, we began an inquiry project that involved internet research, which, as you probably know, can be a teaching minefield. There are the kids that never click past the little summaries that Google provides, and then you’ll have kids who haven’t yet mastered how to use Google in a way that will yield results. Of course, we’re only scratching the surface. I mean, there are the kids who ONLY use the Google image search…and…and…and…
These are all things that you’ll likely have to teach–either in a research conference (like a one-on-one writing conference, but for research), in small groups, or as a whole class mini-lesson. And whenever you teach these things, you’ll want to use an anchor chart that kids can go to for guidance and reminders.
Today, we’ll start with a strategy–actually, it’s more of a habit–that’s at the heart of it all: studying closely, thinking deeply, and connecting the dots.
When we perform really good research, we’re doing several complicated things in our heads all at once. We’re reading, we’re thinking about how what we just read is connected to the other things we’ve discovered, and we’re thinking about why certain bits of information are important. On top of all that, we’re asking questions to think about what else we want to learn about what we just discovered.
Here’s one way you might start to roll all this out: after students have had a couple days to amass a decent chunk of research, roll out this anchor chart…

I tell students, “Today I’m going to teach you a strategy that researchers use to go further with what they’re learning. Sometimes it’s good to cast a wide net, and see how many facts you can find, and other times, it can help to drill deeper into one big fact. Researchers often pause to notice things that jump out at them in their notebooks. They think about how what they’re learning is connected to something else, and sometimes they might think about why certain facts are important. Then they write about these things, and ask more questions. This way, instead of just finding more facts, they can go deeper with their learning.”
Then, I have students take a look at the anchor chart, and then they look through their research notes. I ask them to circle something in their notes where they could try the thinking strategy from our anchor chart (“Which bits of research jump out at you right now?” + “Which bits of research are connected to something else you’ve found?” + “Which bits of research seem like they might be significant?”). Then, they use one of the sentence stems to write some thinking along with some “I wonder…” questions. Some jot notes in the margins, and others write their thinking on sticky notes.
Afterward, we take a moment to share. I ask who is doing an example of “green” thinking (pointing at the green words on the anchor chart) We do the same for the blue and purple sentence stems on the chart. Then, I can have students start researching the question(s) they just wrote down. Before I send them off, I remind today’s focus the by saying something like, “Remember, from time to time, it’s important to pause the fact finding to think about where we might dig a little deeper. Off you go!”
As students work, I can check in and ask them which part of the anchor chart they are using, or I can ask which color of thinking should they be doing right now. When I have these kinds of conversations with students, I’m reinforcing the idea that these anchor charts are more than educational decoration.
I keep anchor charts like the one above on the wall for months. Any time we perform inquiry, I can invite students to transfer what they’ve learned before to the current project. I can also reference it in conferences with students who aren’t sure where to go next with their inquiries.
The big idea here is that we can break skills we want students to learn down into strategies that we teach, and we can write up these strategies on anchor charts that students can use throughout the week, unit, or even school year!
Inquiry work can be complicated and full of twists and turns, but smart use of anchor charts can create a roadmap that helps students navigate these winding roads.
How do you use anchor charts to support your practices? What other questions do you have about using a workshop approach to support inquiry-based learning? I’d love to hear from you in the comments below! You can also reach me on Twitter @MrWteach…and be sure to follow @MovingWriters on Twitter and Instagram!

2 Comments